
feature
Show studies on charts
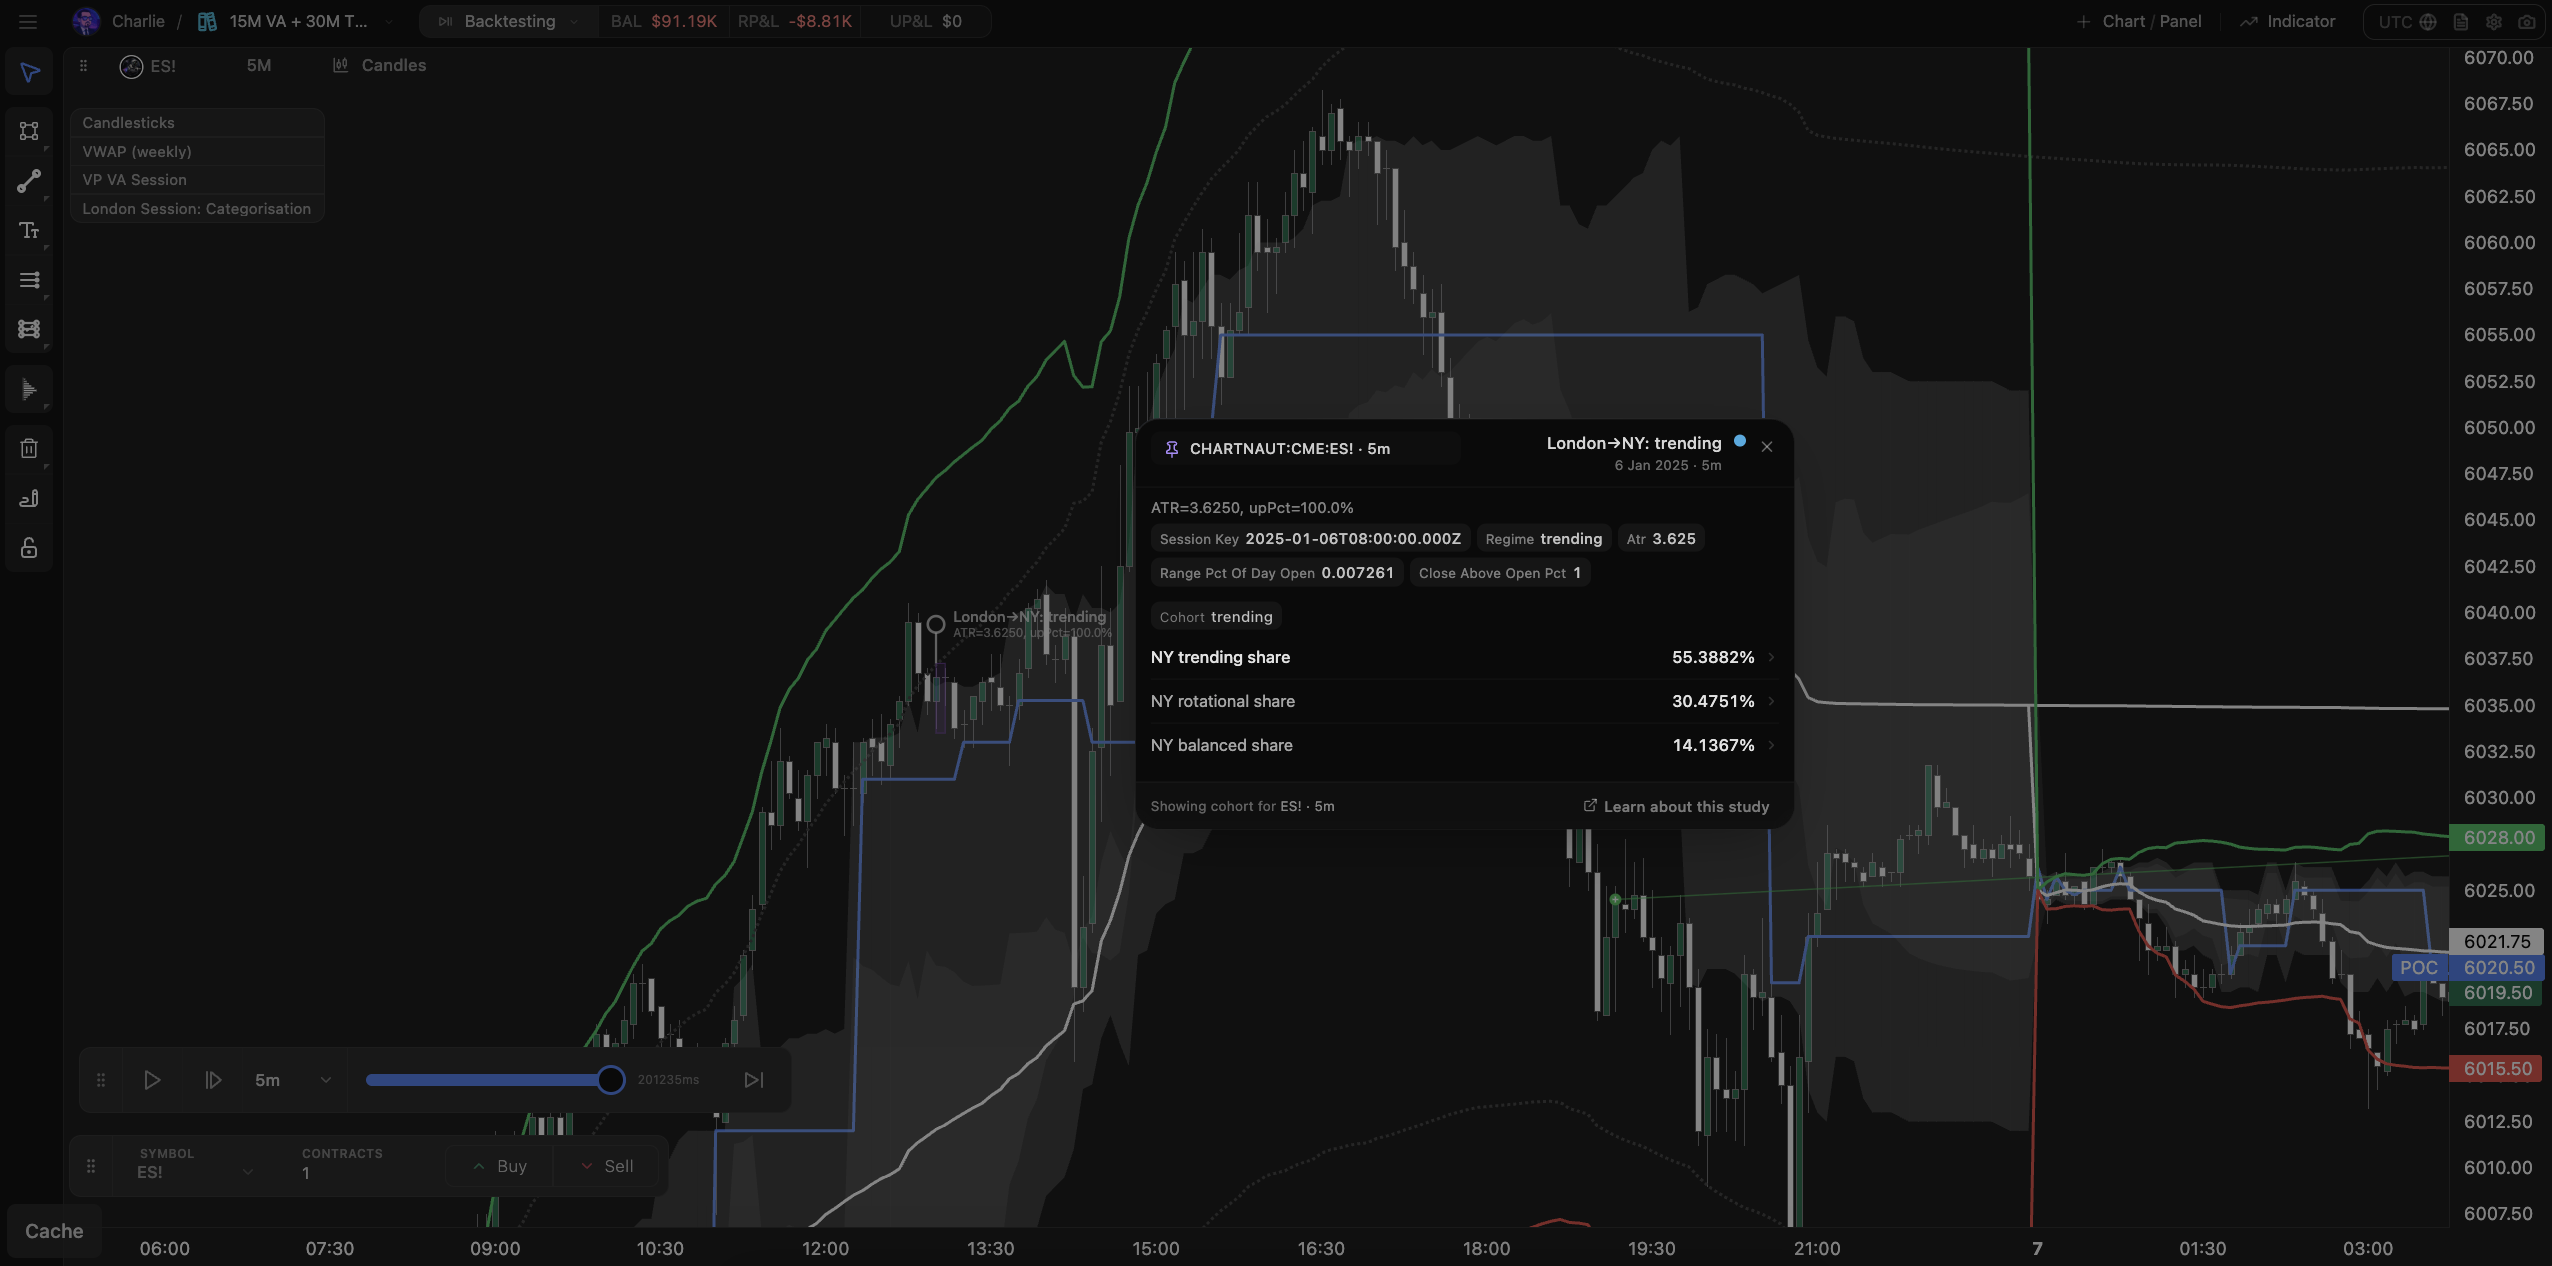
After a study run looks right, Put on chart moves those results into your Terminal as a Forward Insight — so you can see the numbers while you trade or replay.
You do not need to edit study Code to do this. Use the product path below (or let Conductor / the Forward insight agent propose the pin).
What you need first
A finished study run with results you trust
Access to the Terminal
Optional background: Chart pins · Forward Insights
Steps
Open the study run summary in Research.
Click Put on chart.
Chartnaut opens or focuses the Terminal.
Confirm instrument, timeframe, and pin placement if asked.
The pin attaches — click a relevant bar to see cohort stats.
Pin Studio
For more control, open Pin Studio from the run or the Forward Insights tab:
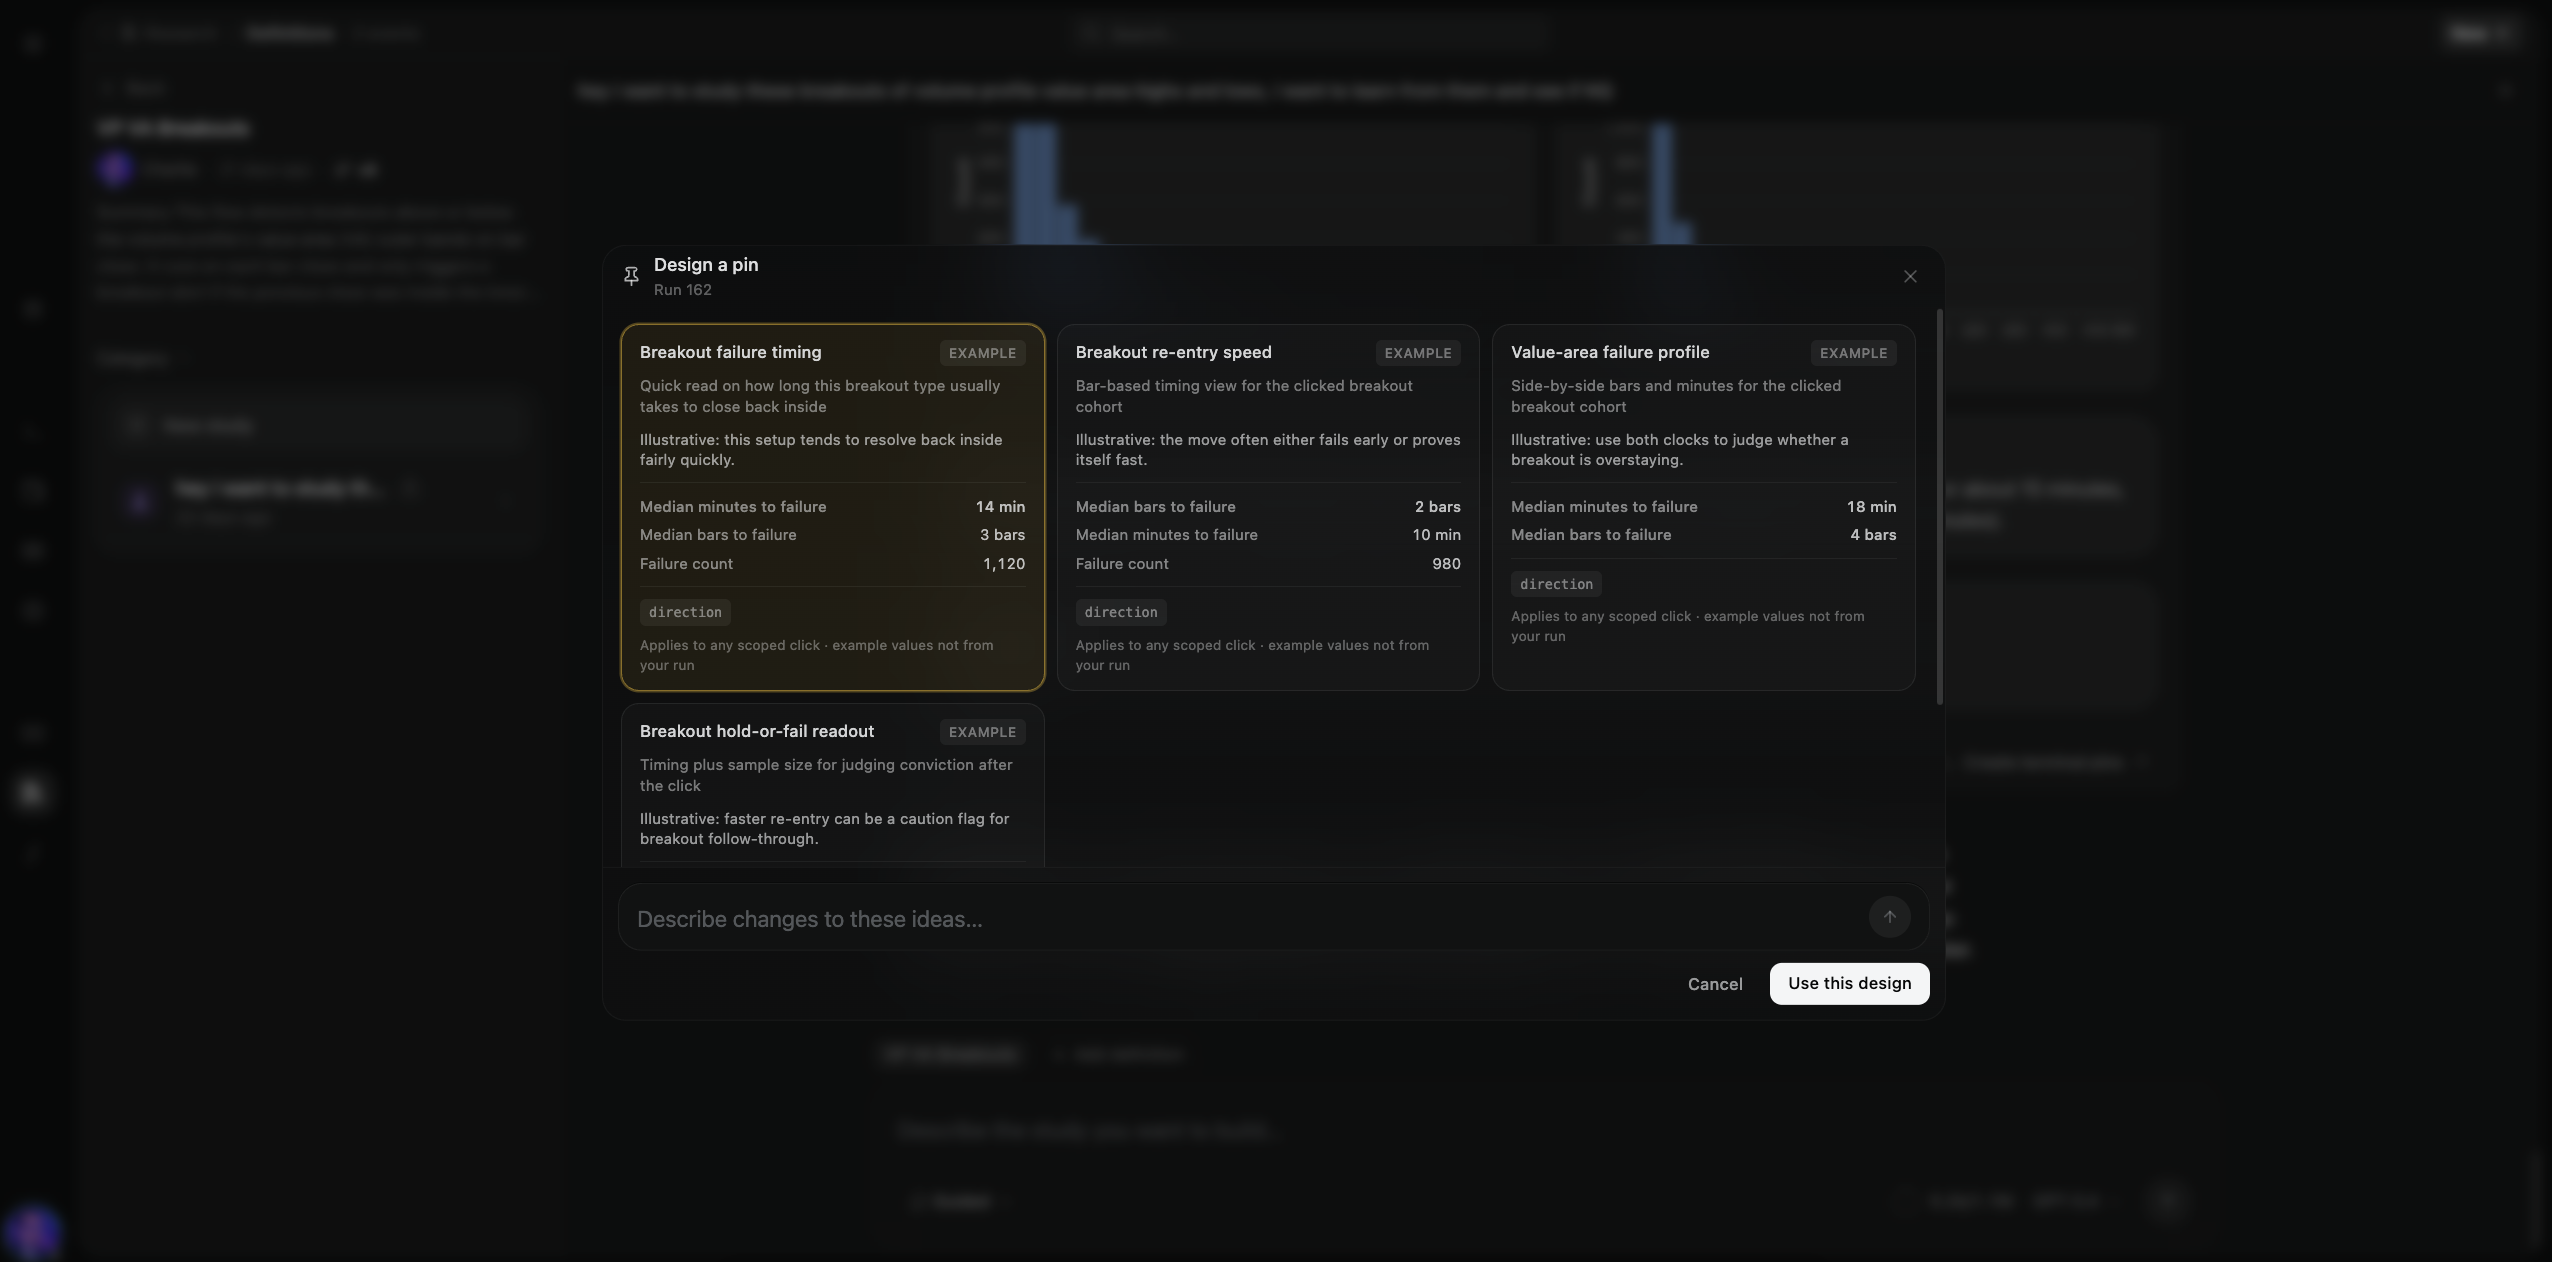
Choose which metrics show on click
Preview layout on the chart
Batch pin multiple runs from the same definition when offered
Pin Studio is optional polish — Put on chart is the fast path.
Agents
Conductor may offer Put on chart after a study finishes — approve or edit before it lands.
The Forward insight agent handles mockups and the pin layout edit. Do not ask the study authoring agent to author pins.
While trading
On Real-time or Replay:
The pin stays active until you remove it from Forward Insights
Switching chartbooks may require re-attaching — check the pin list if stats disappear
If something fails
Pin will not save / validation errors → Pin validation errors
Empty or wrong stats → re-check the study run and which metrics Pin Studio selected